An international research group has succeeded in creating a vulnerability map of the brain. The map shows in which areas of the brain infarcts are associated with a high risk of cognitive impairment and in which areas with a lower risk. By projecting individual patients’ brain scans over the map, their risk can be predicted immediately after the stroke.
Every year, some 30,000 people in the Netherlands are affected by a brain infarct. Half of these patients are left with cognitive impairment or vascular dementia. They may then experience one or more deficits such as memory problems, concentration problems, slower thinking, slower talking, slower acting, more difficulty keeping an overview, more difficulty doing more things at once, in addition to the more widely known physical consequences such as unsteady walking, loss of feeling or paralysis symptoms.
“Until now, we don’t have such a clear story in the clinic for these patients,” says Professor of Neurology Geert Jan Biessels. “Scans are difficult to interpret and cognitive impairment can occur immediately after the stroke but also not until months later. And the extent of brain damage per se says little about the symptoms people experience: some have a lot of damage but hardly any trouble and others have moderate damage and enormous trouble.”
Attempts to relate vascular damage in the brain to cognitive complaints stranded until recently with no real port of call. Geert Jan: “Individual observations of vulnerable areas did exist and a start had been made with so-called LSM studies, Lesion-symptom mapping, the method by which we make brain maps to connect specific spots in the brain with cognitive disorders. But the groups of patients participating in those studies were too small. That left many areas with too little data or the areas became so large that the map lacked detail. Like hearing on the radio that there is a traffic jam somewhere in Gelderland. That’s not much use to you as a road user.”
So in 2017, Geert Jan founded an international consortium, Meta VCI Map, which now made it possible to bring together the data of some 3,000 people with cerebral infarction from 12 studies in 7 countries. “That large amount of data allowed us to create an accurate vulnerability map. The result is a baseline map that covers 90 percent of the brain. In the remaining 10 percent, infarcts are virtually non-existent. All areas on the map have some degree of vulnerability, but there are major differences between them. Some areas have an extremely high probability of eighty to ninety percent that a patient will have cognitive problems from the infarct.” A scientific paper on the vulnerability map recently appeared in Lancet Neurology.
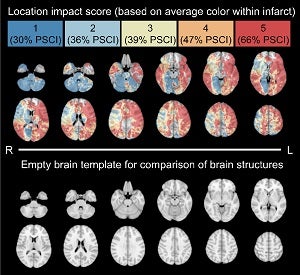
Using the vulnerability map, a diagnostic tool for use in the clinic was then developed. This so-called “location impact score” predicts the risk of cognitive impairment (PSCI – post stroke cognitive impairment) in five grades, see image. Geert Jan: “The map shows in which areas of the brain infarcts are associated with a high risk of cognitive impairment and in which areas with a lower risk. By projecting the brain scan of individual patients over the map, their risk can already be predicted immediately after the stroke. This can be done as early as the emergency room.”
The "location impact score" reflects the risk of cognitive impairment after a brain stroke and is divided into 5 categories for daily use in the clinic. The percentages are averages for the respective category, so category 5 means an average risk of 66 percent. The scientific chart "below it" is more sophisticated and gives percentages for each data point in the brain. Here the percentages can be as high as 80 or 90 percent.
Thanks to application of the “location impact score,” we can therefore see on the map the difference between a dangerous and less dangerous brain infarction. Geert Jan emphasizes that this is about a patient’s risk of cognitive impairment. “To determine whether someone actually has a cognitive impairment, you have to take a cognitive test.”
Both are important for patients, he continues, both for recognition of the problem and for counseling and possible rehabilitation. “A stroke has a huge impact on patients and their quality of life: it hits people at the core of their existence. We cannot eliminate the causes, but we can name the condition and work on rehabilitation in a targeted way. Now it happens that even the diagnosis is not made and people walk around with their souls under their arms.”
The research with the vulnerability map does not stop here. On the contrary. The Meta VCI Map consortium has now grown to 30 research groups from 15 countries and is building a joint database with the data of more than 20,000 participants. For example, the consortium is also working on a white matter map to see where vascular damage occurs in normal aging. White matter is “the fiber optic network of the brain” through which information flows.
Geert Jan: “Brain cells have offshoots that run through the white matter, so to speak, ‘the fast conductors’ that connect everything in the brain. Abnormalities in the tiny blood vessels in those offshoots cause vascular damage, a subtle lack of oxygen that builds up over years. Everyone experiences it, but some are more affected. As with vascular damage after stroke, there is no direct relationship between the amount of damage and the severity of symptoms. That’s why we want to map these abnormalities in the white matter: who has a lot of damage, who at critical points and which ones?”
The maps have further applications. “We would also like to detect causes of vascular damage,” says Geert Jan. “Infarcts and white matter damage can have different causes. For infarcts, for example, it could be a clot in the heart or a clot in the carotid artery, but it could also be the vessels in the head itself. In 25 percent of cases, we don’t know. The pattern and location of the damage can potentially start to point us in the right direction.”
He continues: “A research project like this can only come about with collaboration. I can still see me sitting in that hotel room in 2017: from there in the evening, during an international congress, I sent my invitation e-mail to the various research groups. The next morning I had already received 15 enthusiastic responses. Then followed a time of pioneering and improvisation. With a number of partners, we started a pilot project, in which we were able to remove technical and legal bumps. Then we started working on the vulnerability map, in which PhD student Nick Weaver played a major role in the further development, together with researchers from the Image and Brain diviwsions. The crux is bringing together the expertise needed in the international network. Neuropsychological knowledge from France, statistical knowledge from Scotland, programming knowledge from Hong Kong…. All those pieces together make the ultimate success.”
The brain vulnerability map was created thanks to a Vici grant from ZonMw and with Alzheimer’s Netherlands as a partner.