Untargeted spatial transcriptomics and proteomics
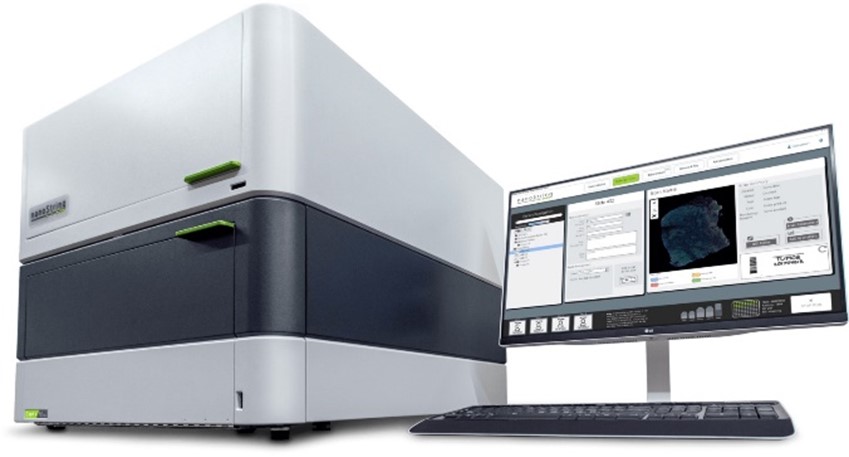
GeoMx® Digital Spatial Profiler (DSP) is the solution for spatial multi-omic profiling.
DSP enables morphology-driven, high-plex profiling on a single FFPE or fresh frozen tissue section. DSP technology combines standard immunofluorescence techniques with oligonucleotide barcoding for readout via NGS or on an nCounter® Analysis System.
The GeoMx® DSP is a novel platform developed by NanoString Technologies. DSP enables spatially resolved, high-plex (10s – 10,000s of targets) digital quantitation of proteins and mRNA in tissue. The assay utilizes unique reagents (antibodies or RNA probes) coupled to UV photocleavable oligonucleotide barcodes.
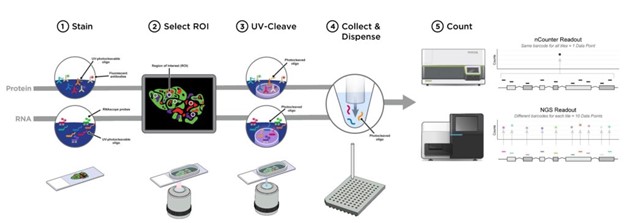
After incubation/hybridization of the GeoMx reagents along with visualization reagents to slide-mounted FFPE or fresh frozen tissue sections, the DSP scans the slides and gives a high quality image for region of interest selection. The oligonucleotide tags are released from user-selected regions of the tissue with focused UV light based on the user region and segmentation selections. Released tags are counted on the nCounter Analysis system or sequenced on a Illumina® next-generation sequencer (NGS). Finally, counts are mapped back to the tissue location, resulting in a spatially-resolved digital profile of protein or mRNA abundance.
| Description | Specification | Description | Specification |
|---|---|---|---|
| multi-analyte | RNA and protein | quantitative resolution | 6 logs of dynamic range |
| segmentation-based profiling | geometric, contour, gridded, and morphology marker-driven | tissue compatibility | FFPE and Fresh Frozen |
| min. segment size | detection depends on size/number of cells in area of interest and expression level small cells: 10-20 cells (protein), 50-200 cells (RNA) large cells: 1-5 cells (protein), 5-20 (RNA) | throughput | >10 sections/day |
| source (laser) | 385 nm (UV cleavage) | multiplexing capability | 96 targets with nCounter readout |
| 20,000+ targets with NGS readout |
Nanostring GeoMx Digital Spatial Profiler
Current techniques offer a trade-off between spatial data and in-depth expression data. Bulk sequencing, for instance, generates in-depth data, but often it tells us little about where these cells were situated in the original tissue. Techniques like single molecule FISH and immunohistochemistry offer us spatial data, but only have a limited amount of targets. USEQ offers a new technique called GeoMX (Nanostring), which combines the spatial data with RNA or protein expression profiles. GeoMX opens up a world of research possibilities. You provide the tissue of your choice and select regions that interest you. This creates a wide range of applications from creating separate profiles for tumor and tumor microenvironment, to finding biomarkers for neurodegenerative diseases, to the effects of COVID infection on gene expression.
Many RNA-based techniques need fresh-frozen tissue. One of the unique strengths of GeoMX is the input of a multitude of types of tissue preservations, including FFPEpreserved tissue. Multi-omics technique Because it is possible to obtain both protein profiles and RNA profiles with GeoMX, GeoMX is considered a multiomics technique. Its strength lies in being able to create datasets of RNA on one slide, and protein datasets on an adjacent slide. These two could then be compared to each other, in order to gain conclusions which would not be possible with only proteomics or transcriptomics.
We stain tissue slides with RNA/protein detection reagents and morphology markers, such as for epithelium, immune cells and nuclei. We are open to custom morphology markers. The tissue is then processed by the Digital Spatial Profiler, creating a high-quality image on a single cell visibility level. We then select regions of interest, in which we can select different cell types based on morphology staining.
These areas are then illuminated, cleaving the RNA/protein reagents only in the illuminated areas. This enables a highly specific region to be selected. These area’s of illumination are collected in different wells. We then sequence this data from the selected regions and generate RNA or protein expression profiles per region or cell type.

