Our facility actively contributes to cutting-edge research in pathology and oncology. Recent highlights showcase how advanced tissue processing, staining, and analysis techniques support impactful discoveries published in leading journals.
Below references of highlights 1 – 3.
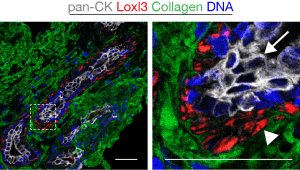
Figure 1. Fluorescence antibody-based multiplex on FFPE tissue sections.
Breast tissue showing a mammary duct and the microenviroment. Green = Collagen I; blue = DNA; white = luminal epithelium (pan cytokeratin); red = myoepithelium (Loxl3). Size bars indicate 50 µm. Arrow depicts luminal cells, arrowhead indicates myoepithelial cells. From https://www.nature.com/articles/s41388-022-02258-1
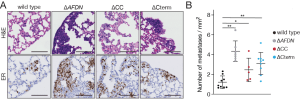
Figure 2. Immunohistochemistry (IHC) combined with Qupath quantification.
Loss of the Afadin drives metastatic disease. A. and B. Shown are H&E stains (top) and immunohistochemistry using a human-specific human estrogen receptor (ER)antibody (bottom) on mouse lung sections. (A) Scale bar, 50 μm. (B) Quantification of metastases, normalised to lung area.*p < 0.05, **p < 0.01. From: https://doi.org/10.1002/path.6394
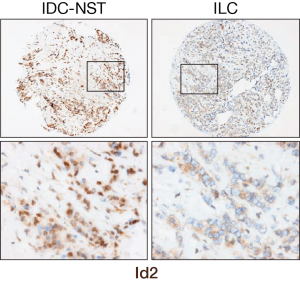
Figure 3. IHC on tissue micro arrays (TMA).
Cytosolic v nuclear Id2 expression in breast cancer. Shown are representative TMA cores (top panels) from invasive carcinoma of no specific type (NST) and invasive lobular carcinoma (ILC) stained for ID2 expression (brown). From: https://www.nature.com/articles/s41388-022-02314-w